
Hatcher Library exhibit showcases variety and value of scientific maps
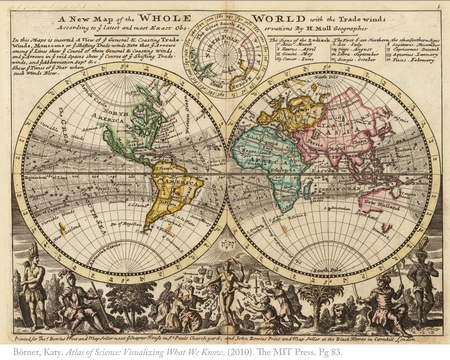
“A New Map of the Whole World with the Trade Winds According to the Latest and Most Exact Observations” by Herman Moll
“Places & Spaces: Mapping Science” at the University of Michigan Hatcher Graduate Library Gallery marks the spot where we are today in the world of science — using 60 maps, interactive globes, illuminated diagrams, and two glass cases filled with book covers devoted to this astoundingly complicated topic.
The colors and forms illustrating these documents are as inventive as any other sort of art, with the difference that each map is intent upon conveying scientific information.
“Are you interested in seeing science from above?” aks the exhibition statement. “Curious to see what impact one single person or invention can have?
“Keen to find pockets of innovation? Desperate for better tools to manage the information flood? Or are you simple fascinated by maps?”
Because if you answered yes to any of the above, “Places & Spaces” has you covered—and then some. This exhibit’s most nifty quality is navigating these maps’ far-flung “abstract topic spaces” with ease and clarity.
For, as the Hatcher Gallery statement goes on to say, the exhibit is meant to inspire “discussion on how to best track and communicate human activity and scientific progress on a global scale.”
This sense of global scale best describes the effort made by the worldwide cartographers and scientists who contributed their life’s work to the exhibit.
We’re all used the standard definition of “map” as being a representation—usually on a plane surface or globe— corroborating a geographic area through conventional depictions of form, size, and internal relationships. Your everyday Michelin or Rand McNally will do in a pinch as a reliable example.
And there are plenty of examples of these maps prominently on display in “Places & Spaces” including a reproduction of Dutch cartographer Herman Moll’s famous 1736 “A New Map of the Whole World with the Trade Winds According to the Latest and Most Exact Observations.”
But as handsome as this map is as a geographic work of art, “Places & Spaces” has many, many other modern and post-modern ideas in mind.
The larger part of this exhibit is devoted to areas of science (many popular but some on the verge of the arcane) whose function is to introduce systematic analysis through information drawn from scholarly data sets and good old-fashioned sleuthing. And these maps schematize information in novel ways to draw bits and pieces into a coherent whole.
Organized by Katy Borner of the School of Library and Information Science at Indiana University, the exhibition is divided into five “iterations” (each containing ten maps) out of a projected decade’s worth of series planned.
The display consists of: 2005’s “The Power of Maps”; 2006’s “The Power of Reference Systems”; 2007’s “The Power of Forecasts” ; 2008’s “Science Maps for Economic Decision Makers”; 2009’s “Science Maps for Science Policy Makers”; and last year’s “Science Maps for Scholars.”
Future “iterations will include this year’s “Science Maps as Visual Interfaces to Digital Libraries”; as well as 2012’s “Science Maps for Kids,” 2013’s “Science Maps for Daily Science Forecasts,” and 2014’s “Telling Lies with Science Maps.”
Of special interest is the work of local contributors. These maps include U-M Molecular and Integrative Physiology professor Santiago Schnell’s “Tick Tock (Somites Transient Cells)”; U-M School of Information professor Lada Adamic’s “Data from the Blogosphere”; U-M physics professor M. E. J. Newman’s “Who is the Best Connected Scientist? A Study of Scientific Coauthorship Networks; U-M Medical School analyst Jeff Horon’s “Michigan Metabolomics and Obesity / Nutritional Obesity Research Center Member Collaborations”; and U-M Sociology and Organizational Studies graduate student research assistants Helena Buhr and Natalie Cotton, and professor Jason Owenâ€Smith’s “High-Tech Related Industry Networks.”
The work of these U-M researchers—as well as that of their peers—ranges from clearly demarcated relatively well-known subjects to the remotest reaches of contemporary scholarship. And it is precisely at this point where visiting the exhibit might turn into a profitable (as well as enjoyable) afternoon’s study.
Nothing’s too big or too small for some imaginative scientist (or team of scientists) to shape and reshape our understanding of a topic though the imaginative resources of cartography. Spanning the expanse of higher education and intellectual think tanks to public agencies and library collections (as well as information plumbed from all sorts of research papers and scholarly journals), the exhibit goes to the heart of everything, everywhere seemingly all at once.
Simply put, the history of science and the history of ideas have never been more visually dazzling; much less intellectually exhilarating. Because “Place & Spaces” maps science’s yesterday, today and tomorrow with an extraordinary gusto.
“Places & Spaces: Mapping Science” will continue through May 24 at the University of Michigan Harlan Hatcher Graduate Library Audubon Room, 920 N. University St. Exhibit hours are 8:30 a.m.-11:30 p.m. Monday-Thursday; 8:30 a.m.-6:30 p.m. Friday; 10:30 a.m.-5:30 p.m. Saturday; and 2:30-11:30 p.m. Sunday. For information, call 734-764-0400.