
With maps: Voter turnout percentages in the August 2010 primary
This story has been edited to update a portion of the map which was based on incorrect data.
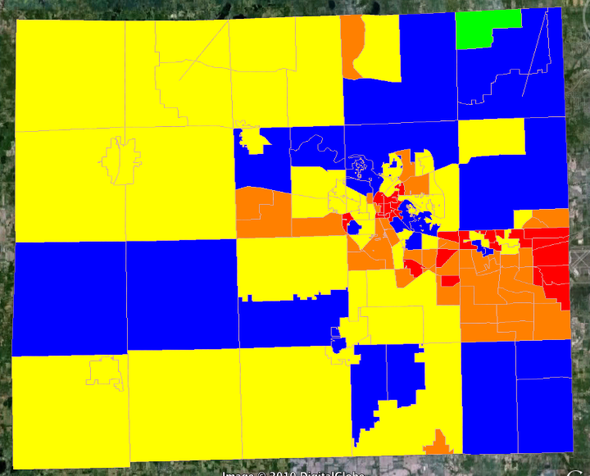
A map of voter turnout in Washtenaw County from the 2010 August primary election. Voting rates per precinct are coded as follows: 0-10 percent in red, 10-20 percent in orange, 20-30 percent in yellow, 30-40 percent in blue, and more than 40 percent in green.
Data and precinct map courtesy of Washtenaw County
Yesterday's column on frequency of absentee voting prompted a question about voter turnout. Thanks to Andy Brush at Washtenaw County, I was able to obtain a map of precinct boundaries across the county, which I lined up with the table of voter turnout in the 2010 primary election in August.
Sources for this data
This map shows the August 2010 precinct count, as provided by the Washtenaw County clerk and register of deeds. A complete set of current and historical election results has archived data online since 1980.
The base map of boundaries for precincts is also from Washtenaw County.
Questions that this data generates, so far unanswered
If you look closely, you see a couple of strange results from this visualization.
Voter participation rates for City of Ann Arbor precincts near the University of Michigan campus are very low in the August election, which accounts for a large red splotch in the middle of the city. When school is out, eligible voters do not vote in city elections. I'll expect that voter turnout will be much higher in those precincts in the fall election, but it's hard to say how much higher. Ann Arbor 1-1 only saw 32 ballots cast in August 2010 primary, but 1,097 ballots were cast in the November 2008 presidential election.
Voter participation rates in Ypsilanti Township are notably lower than for surrounding townships. The eastern edge of Ypsilanti Township votes as infrequently as the absent summer student population of Ann Arbor. Is there a simple explanation for this?
Using maps to check the data
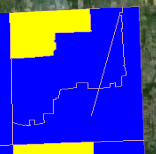
A corrected inset shows the proper voter turnout rate for Salem Township Precinct 2. The original county data listed 725 total registered voters; it should be 1,822. This would make the turnout for the precinct 24.26%; it is colored here in yellow.
Data updated by Matt Yankee, Washtenaw County
One precinct sticks out in the county. Salem Township Precinct 2 had a more than 60 percent voting rate, which is nearly double that of precincts 1 (35 percent) and 3 (32 percent). It's the only precinct coded in green on the whole map. What factor or factors explain that result?
I asked Matt Yankee, acting elections director for Washtenaw County, about the results I saw. He checked into it, and responded that the number of registered voters for that precinct had been recorded incorrectly. "Instead of 725 total registered voters, it should be 1,822. This would make the turnout 24.26%."
The best election map, ever
University of Michigan physicist Mark E. J. Newman has a wonderful collection of election maps from the 2008 election, which distort the political landscape to show equal area by number of voters. The software to produce this is described in the paper "Diffusion-based method for producing density equalizing maps," Michael T. Gastner and M. E. J. Newman, Proc. Natl. Acad. Sci. USA 101, 7499-7504 (2004), and a set of software for producing density-equalizing maps is avaiable under the name cart.
Edward Vielmetti looks at maps for AnnArbor.com .
Comments
Rod Johnson
Thu, Oct 21, 2010 : 12:47 p.m.
Thanks, Ed! Almost all of Ypsi Township is low-turnout. That might have something to do with the ballot in those precincts. though. It will be interesting to see this updated in November, won't it?