
Ann Arbor school district spends least amount of general fund money on its poorest school
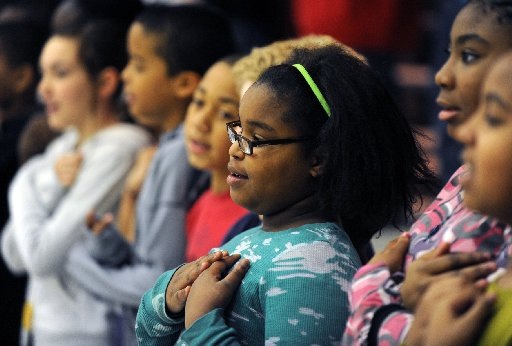
Mitchell Elementary School fifth grader Jeovan'a Nezbeth performs a song with her classmates during the school's Martin Luther King Jr. program. Lon Horwedel | AnnArbor.com
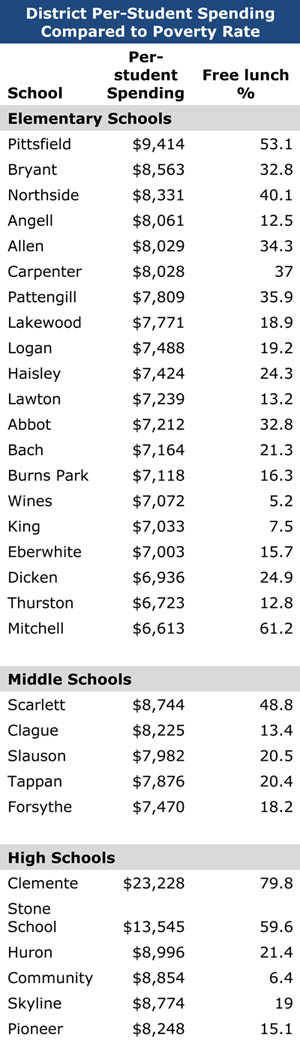
The Ann Arbor school district’s poorest elementary school gets fewer dollars per student from the general fund than any other school in the district, financial records show.
The district spends $6,613 out of its general fund on teachers, administrators, staff members and supplies at Mitchell Elementary School on Ann Arbor’s southeast side, records show. That's $938 per student below the district average of $7,551 spent per student at the elementary level.
But that’s not an entirely accurate picture of what the district spends, administrators say.
They say to get a more accurate idea of how the district is supporting Mitchell Elementary students, funds from two special programs need to be added in.
“Clearly this is a community that is in greater need than many others in the district,” said Lee Ann Dickinson-Kelley, the district’s elementary school administrator. “There are many supports that are not reflected in that number.”
Details of those funds - which come from grants given to the district from the federal government - were not included in the public budget document that shows the spending at every school building. But information on those funds was given to AnnArbor.com after inquiries about the data were made.
The numbers
The district assigns the cost of most of the staff in a school building to that school building’s budget.
Not all employees are included in the breakdown of costs per school. For example, the district keeps the cost of special education teachers, even those assigned to specific rooms at specific buildings, separate from the buildings’ budgets.
District officials said they do that because special education teachers can move from building to building.
Costs per student funneled from the general fund to each elementary school varies widely.
For example, while Mitchell gets $6,613 per student, Pittsfield Elementary gets $9,414.
The range is due in large part to the experience level of teachers at a school, district administrators said. That’s seen in an average teacher salary and benefits cost breakdown.
At Mitchell, the average cost of a teacher, which includes salary and benefits, is $92,348. At Lakewood Elementary School, the average cost of a teacher is $105,905.
The same spread exists at the middle school and high school levels.
At the middle school level, a teacher at Forsythe costs the district, on average, $96,123. A teacher at Clague costs the district $102,059.
At the high school level, a teacher costs the district an average of $113,493 at Stone High School, and $81,361 at Roberto Clemente Student Development Center.
A teacher’s salary is set by the union contract and is based on experience and length of service.
District administrators said the average cost per student can also be influenced by the number of students at a school.
For example, they said, the district spends $18,713,833 out of its general fund at Pioneer High School. At Huron, that number is $16,057,657. But the cost per student at Pioneer is $8,248, compared to Huron at $8,996.Â
The difference? There are 700 more students at Pioneer, meaning costs are spread over more students.
Extra supports
In addition to general fund dollars, several district schools get federal grant money.
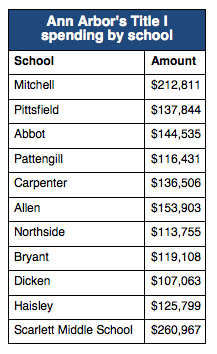
The largest pot comes from Title I funds, which are targeted to schools with poverty rates higher than the school district’s average, which is about 20 percent.
That also means a school might get Title I funding one year, but not the next - depending on the composition of the school’s student body and the district’s overall student body.
In Ann Arbor, 10 of its 21 elementary schools and one of its five middle schools get Title I funds. The district also uses those funds on professional development, support for homeless students and other district-wide initiatives.
The schools receiving additional funds are Scarlett Middle School and Mitchell, Pittsfield, Abbot, Pattengill, Carpenter, Allen, Northside, Bryant, Dicken and Haisley elementary schools.
“Title I money must supplement the general fund,” Dickinson-Kelley said.
That means the district can pay for supplemental teaching positions using Title I funds, but can't pay for general core teachers. In other words, the district couldn’t cut a general fund position and replace it with a position funded by Title I money.
In each of the Ann Arbor schools receiving Title I, that money pays for one or two full-time equivalent teaching positions. In total, just under $2 million is being spent this school year out of Title I to fund teaching positions.
With more than 60 percent of its student body receiving free or reduced lunch rates, Mitchell has a higher population of students living in poverty than any other Ann Arbor school.
That’s the reason the district is dedicating both Title I and Title II funds into the school.
The Title II funds pays for seven teaching positions at Mitchell. Those funds also help pay for professional development across the district. Next month, the district will use Title II funds to pay for only six teachers at Mitchell, with the general fund picking up the other position. The extra Title II funds will be spent on professional development. In total, the district get over $677,000 for Title II money.
The goal is to reduce class size to at least one teacher per 17 students, Dickinson-Kelley said.
“While other schools would certainly want a similar ratio, because of the 1:17 requirement, it would be nearly impossible to spread out the RCS funding to other schools any longer as we once did - the necessary ratio would be difficult to achieve if not concentrated in a single school," she said. "Consequently the district elected to use the funding in support of our most needful building."
It's unclear whether cost-cutting measures proposed by district administrators - including eliminating 34 teaching positions - could impact Mitchell or lead to larger class sizes there.Â
“The district has an ongoing obligation to monitor and adjust these expenditures and subsequent decisions throughout the year," Dickinson-Kelley said. "In fact we will be making some adjustments in a few weeks to ensure the general fund is contributing adequately to Mitchell School while also making Title II support available.”
Is it working at Mitchell?
As Mitchell Principal Kathy Scarnecchia studies the scores of her students on Michigan Educational Assessment Program tests, she sees “our students are still not learning, or at least achieving on this test, at the same rate as the rest of the district.”
Scarnecchia said the extra money is helpful, but she'd like to make sure the district is focusing money - both from the general fund and the various Title programs - on helping the district’s neediest students.
“It’s about trying to equalize that opportunity for students. Our district doesn’t ever really talk about that issue in public," she said. "Certainly the Title I money is helping our students. The superintendent and (Dickinson-Kelley) are facing tough choices. I know they'll continue to support our school.
But she does admit that if they had a few more general fund dollars, the Title money could be making an even bigger impact on the Mitchell students.
"I think there could be more done if we were starting at the same base (as other schools)."
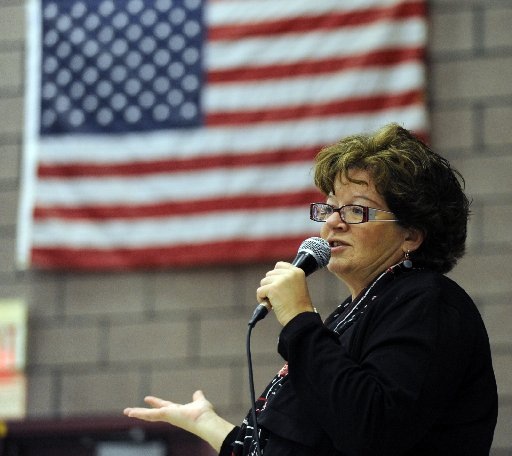
Mitchell Elementary School Principal Kathy Scarnecchia speaks at an MLK Day event. Lon Horwedel | AnnArbor.com
To view budget data about an individual school, click on the PDF.
David Jesse covers K-12 education for AnnArbor.com. He can be reached at davidjesse@annarbor.com or at 734-623-2534.
Comments
skfina2
Sat, Jan 30, 2010 : 11:13 a.m.
@DonBee, Plymouth-Canton teachers are part of the state retirement system, which is mandatory for all public school teachers in Michigan. We have the option of voluntarily contributing to a 403(b) plan, but only certain ones that work with our district. Approximately half of PCCS teachers take that option.
DagnyJ
Thu, Jan 28, 2010 : 2:38 p.m.
I know this is unrelated, but look at the percentage of free lunch students at the two alternative high schools considered for closure/consolidation, and the one that isn't. Kind of explains why some might wonder if AAPS caters to the affluent.
Basic Bob
Thu, Jan 28, 2010 : 6:21 a.m.
Cost per student is a good number to look at, only if the schools are full. The first student is the most expensive. That explains most of the difference in per-student cost for half-empty schools such as Pittsfield, Scarlett, and Clemente. Pioneer is filled beyond capacity, making it the most cost efficient school.
AMOC
Wed, Jan 27, 2010 : 9:36 p.m.
DagnyJ - The AAPS User Friendly Budget says "Title I - AAPS: Federal funds to help disadvantaged students meet high standards by providing instructional services to eligible K-8 graders in reading, writing, science, math and social studies;..." It appears that there could be some Title I-eligible 8th graders at Clemente, but since Stone offers only Grades 9 -12, Federal law would prohibit use of Title I funds at Stone.
DagnyJ
Wed, Jan 27, 2010 : 9:19 p.m.
Here's a question: How much Title I or Title II money is spent at Clemente and Stone? Clearly these are schools with need.
David Jesse
Wed, Jan 27, 2010 : 7:35 p.m.
@DonBee: The remaining Title I money is spend on a variety of tasks. I can post a list tomorrow. @Andy: Yes, the Title II money can be used for professional development and teachers. The district has put much of it in Mitchell. The remaining money is being spent on professional development, as is noted in the story up above.
Andrew Thomas
Wed, Jan 27, 2010 : 7:27 p.m.
Grumpy: I feel your pain. Here's my takeaway from all this chatter: 1. Contrary to what the headline of this article implies, the District spends more money per pupil on its most economically disadvantaged schools, and less money per pupil on its more affluent schools. 2. How you feel about this probably depends on your politics, but a strong argument can be made that the most disadvantaged schools need more resources to achieve results. 3. The District, faced with the need to cut approx. $20 million from the budget, has come up with a set of proposals that spread the pain in a fairly equitable way and minimize the effect on the classroom. 4. For all the rhetoric that has been exchanged, nobody has come up with a more equitable plan to accomplish what needs to be done (I don't consider making the teachers take the entire brunt of the cuts with a 10% pay cut to be an "equitable plan" -- but I know some disagree.)
Grumpy
Wed, Jan 27, 2010 : 7:07 p.m.
What is the point to all of this discussion? I'm looking at all of these numbers embedded in posts. There's a couple of spreadsheets uploaded that I can't even open. The headline in the article says Mitchell gets the least amount of money. So what? It appears avg MEAP scores are all within 400 pts. Teacher compensation is all at a similar order of magnitude. Spending per student is all in the same ballpark. DonBee says do your own research. I'm glad I didn't because this whole article and the 67 posts, mine included, seem to be one giant DUD. Just a lot of people with a lot of time on their hands. Where's the big EUREKA finding by the average concerned citizen? A poster in an earlier article made the comment that we all DON'T have to spend 3 days looking at this stuff. Maybe he's right after all. I think that person said compensation is 85% of the budget. As much as I think teachers are underpaid for the endless thankless work they do, the big picture seems to indicate there's only one answer to this problem. This series of stories is exhausting. Are we not seeing the forest through the trees? Is it possible the school board isn't hiding anything in their "user friendly" budget?
Andrew Thomas
Wed, Jan 27, 2010 : 6:57 p.m.
"Consultants" covers a multitude of non-payroll people who work on a contractual basis for the district. They are not necessarily what we usually think of as "consultants". Someone hired to help produce a newsletter, for example, might show up as a consultant. In many instances, the cost of utilizing a contractor is significantly lower than hiring someone, even on a temporary basis.
Andrew Thomas
Wed, Jan 27, 2010 : 6:52 p.m.
My understanding of the Title II grant is that is given district-wide, and is much less restrictive than Title I money, which must be targeted to specific Title I schools. Tiitle II can be used for teacher development, technology, or teacher support for "at risk" students. It looks like the District decided to use most of the money at Mitchell for teacher expenses. I don't think 7 FTE's add up to $830,000 so I am guessing that some of the money was used for teacher development. I don't know if that took place exclusively at Mitchell, or was spread around the District. I can probably find out tomorrow.
J. A. Pieper
Wed, Jan 27, 2010 : 6:43 p.m.
I attended one of the budget meetings and carefully went through the user friendly budget book each table had access to for discussion. One expense that was not listed in the report was the district use of consultants. Although there are some rational, cost effective uses for some consultants, what we need to have access to is a complete report of consultants used by the district, and how much they are paid. One school in the district has a consultant hired to help the current administrator do the job expected. Think about this a minute, do you have a paid consultant to help you do the job you were hired to do? Maybe the public should request information on the district's use of consultants and see if funds can be saved in that area.
DonBee
Wed, Jan 27, 2010 : 6:24 p.m.
OOPS - I misread Andrew's post and mixed up title I and title II, but I found something anyway. The numbers in the table for Title I are $899,885 short of the amount given in Title I money from the Federal Govt. So, does anyone know where that money is being used? In Title II money - I find 2 grants int the budget - one for $830,391 for teacher training and class size reduction and one for $42,518 for teaching with technology. I would assume that since the only school with a Title II footnote (my bad on the first post) - is Mitchell that this money (at least the larger grant) is focused there and would cover the 7 FTE's in the footnote, at about the right cost per teacher. My apologies for my mix up - I was working and researching at the same time.
AMOC
Wed, Jan 27, 2010 : 5:34 p.m.
@Lisa Starfield - I agree with you. Each building and each collection of administrators, teachers and families which make up a school community are unique. Anyone who has worked with a variety of colleagues and through several reorganizations, as I have in the auto industry, understands clearly that it is easier to get good results when you're working in an aligned, supportive and collaborative atmosphere. My point was that there was a community at Northside that was getting extraordinary results in the form of student achievement well beyond that expected for the students they had at that time, and a remarkable improvement in school climate / record on discipline from the mid 1990's. A change in the principal was made by the Board of Ed; several changes of teachers followed. To be completely fair some of those teacher changes may have been in the works before the surprise announcement of a change in leadership. Three years after the change, the school climate is noticeably different and student achievement has slipped from the previous levels, and not only on the new MEAP Writing assessment, on which no district is scoring very well. These are the personal observations of the various parents who researched comparative MEAP scores across the district and the state because the school stopped publishing scores in the Federally-mandated annual report. Northside still participates in AAPS's in-district "schools of choice" program, and now has even more space available than it did when I moved my kids there in fall 2004. The observations show correlations over time. They may or may not be causal. Northside has had either 1 or 2 FTE Title 1 teachers during the entire time I was a parent in that community. There were significant expenditures in the school from various Special Ed line item budgets as well. Those teachers and aides were almost always careful to consider the needs of not just "their" students but all the students at the school. So the General Fund expenditures never were the whole story about per-pupil expenditures, as they are not for any other AAPS school. Other parents may have observations of the effects of changes in personnel, programs and budgets at other schools, and this is a good forum to share them. AAPS urgently needs to find ways to continue and expand those programs that are highly cost-effective, and to improve those which are either not effective in providing safe environments in which students learn at least what's expected by the established standards or which succeed only at extraordinary high monetary costs. Given the facts in another article in this AnnArbor.com series, I believe the program at Roberto Clemente is an example of the latter case.
David Jesse
Wed, Jan 27, 2010 : 5:02 p.m.
Here's the FTE paid for by Title I at each school. Remember that other things, such as tutors, supplies, etc. can also be paid for out of Title I monies at each school. The total listed above for each school includes those items. Carpenter - 2 Allen - 1.5 Mitchell - 2.5 Bryant - 1.5 Scarlett - 1.8 Pittsfield - 1.5 Pattengill - 1 Haisley -.5 Northside - 1 Abbot - 1 Dicken - 1
David Jesse
Wed, Jan 27, 2010 : 4:54 p.m.
Each Title I school listed has teachers funded by Title 1 dollars. Mitchell is the only school that has seven teachers funded by Title II dollars. Those seven are on top of the Title I dollars. Let me dig in my files and find the number of teachers at each school.
DonBee
Wed, Jan 27, 2010 : 4:49 p.m.
Andrew Thomas - Good catch, I had not added up the total for Title I dollars in the article. It turns out it adds up to $1,628,722 dollars, and the user friendly budget shows a total of $2,528,607 in Title I grants. The delta is $899,885. If all of that money went to Mitchell ( and I don't know if it does, but Mitchell is the only school with the funding for teachers from Title I that shows in the budget - that i can find). then the total budget for the school would be (including the $899,885) $2,951,179 or $10,615.75 per student and near the top of the list. Maybe someone at AnnArbor.Com could confirm the missing $899,885 and where it goes or get good numbers for Mitchell, since we know that 7 FTEs are not available for the $212,811 that shows in the table from AAPS. Thank you for helping to solve this one.
Lehigh
Wed, Jan 27, 2010 : 4:21 p.m.
I'm not sure I see eye to eye with DonBee on some or many issues, but I praise him for actually compiling numbers. He's done a ton of legwork on this. And he puts the data out there to be verified, or discounted. This is 1000 times better than making unverified and/or unverifiable claims! (and yes, I realize that itself is an unverifiable claim. Maybe it's only 500 times better). So once again I salute DonBee. If he made a mistake, he made a mistake. But he did not try to hide it or cover it up. Good research is all about verifiability, and DonBee puts numbers out there to be verified. He advances the discussion, and he is an asset to the board. Saying we should dismiss his posts because he made one mistake is ridiculous demagoguery. Now, if someone provided evidence that DonBee deliberately created numbers he knew were misleading, I would take issue. But I have seen no evidence of that.
Andrew Thomas
Wed, Jan 27, 2010 : 4:19 p.m.
Okay everybody -- I finally figured out why the per student expenditures at Mitchell are so low. If you go to the "user friendly budget" and look at the classroom teacher FTEs for Mitchell, you will see they have 7.0 FTEs. You will also notice a double astrisk ** with a footnote indicating "Additional 7.0 FTEs are funded from the Class Size Reduction Grant (Title II)." In other words, half of Mitchell's teaching staff are funded by Title II, not the general budget. Mitchell is the only elementary school in the district with any teacher FTEs specifically allocated to a grant (if you don't believe me, go back to the "user friendly budget", you will see that Mitchell is the only school with this footnote to its FTEs.) So the per-school budget for Mitchell understates true expenditures by 7.0 teacher FTEs. Using DonBee's average teacher cost of $92,348, this amounts to an additional $646,436 in classroom expenses, which, when added to Mitchell's general funds budget of $1,838,482 equals $2,484,918 which divided by its enrollment of 278 results in an average expenditure per student of $8,939. This would place it second behind Pittsfield in per-student spending. Again, the headline is factually correct but very misleading. And I hope this puts to rest the argument that the district is assigning fewer resources to its most needy schools. The opposite is clearly true.
treetowncartel
Wed, Jan 27, 2010 : 3:46 p.m.
Clearly, the comments from both sides of the aisle in this post show that we can not tie teacher merit pay to performance on standardized tests. teachers are not on a level playing field when it comes to the maleable subjects put before them.
ShadowManager
Wed, Jan 27, 2010 : 3:33 p.m.
Surprise! Ann Arbor skimps on the poor but lavishes money on sports and art high schools for professor's kids. Just like old UM.
The Grinch
Wed, Jan 27, 2010 : 2:33 p.m.
Again, DonBee, let me state it clearly: If you can get so simple and so straight forward a thing as teachers cashing in their sick time wrong, something that can be checked quite easily simply by reading the contract, why should any of your complex "analyses" be trusted? It's not that I don't LIKE your numbers. It's that I don't TRUST them. That just as your agenda led you to make a demononstrably incorrect statement about sick time, your agenda likely drives your so-called "analysis" of the numbers. And just as you refused to aknowledge you were wrong on the simple and straight forward issue of sick time, I expect the same were I to go to the trouble to come up with different numbers. At the end of the day, you've made it apparent, sometime's clearly so, sometimes through your disingenuous claims of not having an opinion and then presenting slanted data, that you think the schools are overfunded and that teachers are overpaid. Fine. That's an opinion. Just remember that you get what you pay for.
Grumpy
Wed, Jan 27, 2010 : 2:18 p.m.
Wow. DonBee is bringin' it. I hope he gives the city financials this treatment when that info is released. Grinch, looks like he posted some of his numbers in the "more info" section for your and anyone else's consumption and manipulation. I for one would prefer to hear you point out flaws in reference to his numbers rather than read personal attacks. Although, Mr. Jesse, I can open up DonBee's files on a smartphone, but not on a desktop. Looks like they are zipped files? Perhaps you are aware of this problem already? Or perhaps it's an issue on my end.
DonBee
Wed, Jan 27, 2010 : 1:58 p.m.
@ The Grinch - I did admit I wrong and apologized. Go back and look. Unlike your comments on the DDA here in another thread. It took me 20 minutes to find the law on the State of Michigan website. If I have any agenda, it is trying to figure out what the numbers mean and where the money is going. I still am fighting an uphill battle to get real numbers on the cost of the school administration building by building (where I suspect, but can not prove there is an excess of money spent). And yes I am of the opinion that some benefits - for all Public employees - not just teachers need to be looked at given the fall our state has had in national rankings. I do not want to see the state go bankrupt and I do not want to see more College graduates feel they have to move out of state. I am sorry you feel I have an anti-teacher bias. There are things I don't like about the educational establishment, but to a large extent, I like most of the teachers I have worked with over my life time. If you don't like my numbers - then find other numbers - instead of trying just running others down. Dig in figure it out and post some answers. All - Remember your milage may vary, do your own research and come to your own conclusions. I make mistakes, so do others.
owlnight
Wed, Jan 27, 2010 : 1:58 p.m.
If teachers quit or retire they may do not get any sick time momey. But teachers that have sick time is on the book untill thay use it up or quit or retire so it is part of the benefits
Lisa Starrfield
Wed, Jan 27, 2010 : 1:52 p.m.
AMOC, Switching buildings is not an easy thing. Besides the basics of moving your classroom and learning where everything is, there is a unique dynamic in each building, each faculty is unique and each student population has its own flavor. Some teachers won't fit in some places but will in other buildings. Some teachers work really well with certain colleagues, collaborating closely. Those kind of relationships aren't built over night. Some teachers have spent years building up supplies and equipment in their building to strengthen their program; it would be left behind and possibly wasted as another teacher may not know what to do with it or may have a different approach.
AMOC
Wed, Jan 27, 2010 : 1:46 p.m.
@DagnyJ - You said "I also know that the district has invested in making Northside more attractive, which was a result of the push to redistrict back in, oh, 2003 or so." I can speak to this to some degree, because my children were enrolled at Northside through the in-district choice option. There was a very strong effort in the Northside community of principal, teachers and parents, to turn student achievement and behavior around at that school, starting around 2000. They got a small amount of extra money in the "school improvement funds" category for I believe it was 2 years, and they put a lot of SIT and professional development effort into the Northside Pride program. Everyone, adults and kids, talked the same talk and walked the same walk. Every adult knew what behavior was forbidden and what should be encouraged, and the parents in that community regularly showed concern for every child. When my kids arrived there in 2004, this program was a thorough success of several years' standing. However, since the departure a few years ago of a hard-working and very effective principal, Northside is no longer significantly outperforming expectations based on their student populations' SES. Now they are only about as good as the average elementary in Ann Arbor, which isn't bad, but isn't nerely as good as they were. Several experienced and effective teachers transferred out of the school when the principal was reassigned; several others retired, early in at least one case. Those who left were replaced with teachers who were not oriented to the Northside Pride program by the new principal when they were hired. By 2008-09, her last year as an elementary student, my youngest was openly dismissive of the school administration, because the principal and many teachers no longer upheld Northdside Pride.
The Grinch
Wed, Jan 27, 2010 : 1:34 p.m.
DonBee: You were not "pushed into a corner". It was a baldly incorrect statement you made in your effort to prove (albeit while claiming not to have an agenda) that teachers in the AAPS are overpaid. I'll take your word it was a mistake, but it was a mistake driven by your agenda. But let's not fool oursleves that you were "pushed into a corner". You painted yourself into a corner and, having trapped yourself, you refused to acknowledge you were wrong.
AMOC
Wed, Jan 27, 2010 : 1:22 p.m.
I think the headline for this article is just right. It's true, clear, and nuanced. Because of the district decision to concentrate Title II funds requiring reduced class sizes or increased teacher / student ratio at Mitchell, that school receives fewer dollars from the General Fund than others with similar student populations. When that particular grant is included, Mitchell moves up the rankings The article goes on to explain this, and further comments that Title I, Title II and Special Ed funds are not included in the User Friendly Budget published by AAPS, but can be very significant in supporting students at the various schools. When these amounts are added to the General Funds, a very different pattern of per-student expenditures might be detected, as in the case of Mitchell. As Lehigh commented earlier, even with Mitchell having the highest need and the lowest General Fund (but not total!) expenditures, the district spends more in schools with a higher proportion of students eligible for free or reduced-price lunches. When Title 1 and Special Education funds are added, this "more money to schools where there is greater need" pattern becomes even more pronounced. Which is what the progressive population in Ann Arbor wants our school district to do, right? Give the most help to those who need it? What the discussion about the impact of teacher seniority and pay-step-level on a schools' per-student expenditures tells me is that AAPS needs to significantly revise the seniority-driven system under which teachers are assigned to schools within the district. Because teacher quality has been shown to be critically important for improving student achievement, we should be moving towards assigning our most effective teachers, as measured by their students *growth* in test scores across a school year, to work in those schools where the students face the most challenges to learning. And of course, because the AAEA is a progressive organization with the best interests of the students as their most important concern, they will pro-actively request these changes when they meet with the district administration to negotiate the next contract.
DonBee
Wed, Jan 27, 2010 : 1:09 p.m.
@ The Grinch - I was pushed on the subject into a corner. My original post told people to go look it up. They pushed for me to figure it out, so a spent a few hours looking at state law and the AAEA contract. To the best of my ability to tell that was allowed. In fact I listed 3 things teachers could do. I was wrong on 1 of the 3. Note that I always tell people to do their own research, ask their own questions and make their own conclusions. I have never presented that I am an accountant, lawyer or other specialist that knows how to do this, I am a parent who is interested in sorting it out. I note almost everyone on these boards has made mistakes, yourself included. I at least apologized for mine on the board. Thank you for pointing out we can all make mistakes. I will also point out that I have NEVER suggested that teachers take a pay cut or that they do not work hard. I can only post the numbers that I can get my hands on (note my request to AAEA to release additional numbers if they do not like what was posted).
The Grinch
Wed, Jan 27, 2010 : 12:56 p.m.
Regarding DonBee's "numbers" which always, always, always seem skewed to present teachers in the worst prossible light, please realize that in another discussion regarding the teachers "salaries" (he always throws things into teachers salaries that are not part of their salaries) he insisted that in the contract betweeen the AAEA and the AAPS teachers were allowed to cash in their sick days upon retirement and receive tens of thousdands of dollars. Several people told him it was not the case. He insisted it was. Turns out, its not. So if DonBee can be so incorrect about so simple a fact so easily checked, beware of the numbers he certainly has manipulated to serve his purpose. In other words, do your own analysis.
DagnyJ
Wed, Jan 27, 2010 : 12:52 p.m.
Wow, so what is up with Pittsfield?
DonBee
Wed, Jan 27, 2010 : 12:33 p.m.
If the title 1 money is NOT included in the building by building totals (and I can not tell if it is or it is not in the "user friendly" budget. Then the change at Mitchell is $766 per student in spending, not enough to move it above the average. Total the Title 1 money adds an average of $174 per student to the total spending at the elementary level. The updated list (including Title1 money) sorted from high to low is: SchoolPer student spending Pittsfield..$10,022 Bryant..8,941 Northside..8,744 Carpenter..8,438 Allen..8,430 Pattengill..8,183 Angell..8,061 Average..7,826 Lakewood..7,771 haisley..7,726 Abbott..7,699 Logan..7,488 AA Open@Mack..7,414 Mitchell..7,379 Lawton..7,239 Dicken..7,218 Bach..7,164 Burns Park..7,118 Wines..7,072 king..7,033 Eberwhite..6,853 Thurston..6,763
Macabre Sunset
Wed, Jan 27, 2010 : 12:30 p.m.
As an aside, DonBee (and thanks for your work), Bryant wouldn't be in the database because it is a K-2 school (it's more-or-less joined with Pattengill).
Patti Smith
Wed, Jan 27, 2010 : 12:21 p.m.
DonBee, re: your question of 403b and pension funds. My district (not P-C) has the pension and the 403b. You choose to contribute to the 403b, but the pension contribution comes straight out of my check. I could be wrong, but I think all public (not charter) school districts are in the pension fund per state law.
Julie
Wed, Jan 27, 2010 : 12:05 p.m.
Small point, but I'm guessing the high building cost at AAO might be due to the pool? All middles schools have them.
DonBee
Wed, Jan 27, 2010 : 12:05 p.m.
Lisa - Plymouth-Canton is growing, but not that quickly.............................2004.........2005........2006.........2007.........2008 Enrollment.......17,489......18,608.....18,295......18,895......19,140 The bottom of the step table is AAPS $39,540 P-C $39,954 The top of the step table is AAPS $87,774 P-C $80,646 NOTE: Plymouth Canton in their current 2 year contract eliminated all the columns in the step table beyond MA+30 - So that the table is now BA, MA, and MA+30. In Contrast the AAPS table has BA, BA+30, MA, MA+30, Ed Spec., BA+90, PhD. To be fair to the AAPS teachers the top of the scale for MA+30 is $81,626 The 2008 school year in Plymouth-Canton used a very similar table to AAPS in terms of columns, it was collapsed in the 2007-2009 contract for this school year. In 2009 Plymouth-Canton dropped MESSA and went to a pure BCBS program (100% paid premiums). They also use a 403b plan for retirements. I do not know if that means they are completely out of the state retirement program or not. I have a call into P-C to ask. Instead of the points system for paying coaches, the additional amounts are based on BA salary schedule and range from 2% of annual pay to 11% of annual pay.
David Jesse
Wed, Jan 27, 2010 : 11:44 a.m.
@Grumpy: I should be able to post it, or anybody's else spreadsheets. I will identify by user name who is sending me stuff before I post. Also, please identify (in any e-mail to me with files) the source for the data, so I can double-check to see that the data being used is what you are saying it is. Anyone can e-mail me files at davidjesse@annarbor.com
Grumpy
Wed, Jan 27, 2010 : 11:33 a.m.
Mr. Jesse, would you also be able to post DonBee's spreadsheet and/or database in your "more info" sectin if he emailed it to you?
Lisa Starrfield
Wed, Jan 27, 2010 : 11:32 a.m.
Don, My first comment to you is based upon my experience in the district; it is primarily anecdotal. I do not know what data could be available to explain why teachers switch buildings. It is a personal decision or it is dictated by the district. My second comment is asking YOU for more data because you are restricting your analysis to a very simplistic set of numbers without ascertaining if you are comparing apples to apples.
DonBee
Wed, Jan 27, 2010 : 11:13 a.m.
Lisa - Thank you for your comments, do you have any data to support any of your comments? Or is it purely your observations? I am looking for data please.
DonBee
Wed, Jan 27, 2010 : 11:06 a.m.
Jim Mulchay - I tried to take the MEAP data from the state and compare it to building expenditures by student. There are a lot of numbers in the MEAP database at the state level so I did what I could to make it possible to post. Here is my method (others please invent your own)...I took the the average score by subject and added them together (e.g. math, reading, etc) for each grade (grades 3 to 5 were the grades) to get an average number of points by grade. Then I added the 3 grades together to get a total for the tests by building. This may or may not work for others, it was a quick and dirty way to get a total number of points per building. There is a lot deeper analysis scientists can do with these numbers. Then I took the average spending per student by building and added it to the table. The average spend comes from the user friendly budget. The MEAP scores from state database. Here are the numbers (I hope the format is better this time). School Name....MEAP total........Per Student ABBOT..............5663................7,414 ALLEN...............5709................7,212 ANGELL............5899................ 8,029 AA OPEN..........5729.................8,061 Average............5754................7,652 BACH................5769................7,164 Bryant................. NA................8,563 BURNS PARK......5861.............7,118 CARPENTER.......5662.............8,028 DICKEN................5730.............6,936 EBERWHITE.........5792............6,853 HAISLEY...............5717.............7,424 KING................... 5921.............7,033 LAKEWOOD..........5750.............7,771 LAWSON............. 5852.............7,239 LOGAN................5795.............7,488 MITCHELL............5474.............6,613 NORTHSIDE.........5694.............8,331 PATTENGILL........5653.............7,809 PITTSFIELD..........5537.............9,414 THURSTON..........5823.............6,763 WINES..................5829.............7,072 NOTE: Bryant was not in the state MEAP database. Mitchell has the lowest MEAP score and the lowest spending per student. Angell has the highest MEAP scores and one of the highest spending per student rates. BUT there is no clear trends in this data.
DagnyJ
Wed, Jan 27, 2010 : 11:04 a.m.
Lehigh, OK, I'll believe you. Except I still think there's something weird about the numbers. I wonder what would happen if you could compare the data across several years. You know, as a statistician, that findings with a sample this small (20 schools, one datapoint for each school for race, poverty, spending) has major problems. What if we had data for the same 20 schools for each of five years? I would suspect that Pittsfield is suddenly high because there are several teachers about to retire, and Mitchell is low because experienced teachers transfer. I also know that the district has invested in making Northside more attractive, which was a result of the push to redistrict back in, oh, 2003 or so. Here's another possibility: What elementary schools is the district pushing as choice schools for in-district students? Are those schools getting higher spending?
David Jesse
Wed, Jan 27, 2010 : 10:55 a.m.
I couldn't find a good way to post it in the comments, so I'm posting at the bottom of this story an Excel file the state releases on MEAP results, by building, by grade, by test subject. This is the file of all the districts and buildings in the state, so you'll want to do some cleaning up to get to just Ann Arbor.
Lehigh
Wed, Jan 27, 2010 : 10:55 a.m.
DagnyJ, wanting something to be true does not make it true. Based on the numbers we're presented, there is NO EVIDENCE to support your hypothesis. You're smart enough to ask good questions; I believe you're smart enough to answer some of them, too. Just to do a bit more digging, I added the % African-American and the % Latino/Hispanic numbers together for each school (I've just been looking at elementary schools in all of these posts). The correlation between % African-American/Latino/Hispanic and per-student spending is 0.25 -- again, a positive relationship. Meaning, a higher proportion of African-American/Latino/Hispanic students is associated with higher per-student spending (given the numbers provided by AnnArbor.com). And if you're curious, the % African-American/Latino/Hispanic correlates with the % free lunch at 0.94 across the 20 elementary schools. And as has been shown above, a higher proportion of free lunches is also associated with more (not less) per-student spending.
Lisa Starrfield
Wed, Jan 27, 2010 : 10:47 a.m.
Nope, I was wrong. The numbers just run too close together in y browser
DagnyJ
Wed, Jan 27, 2010 : 10:45 a.m.
Also, it would be very helpful to see some kind of achievement data for all schools. And not just a percentage passing, or average score. Perhaps the district can offer the distribution of scores. Yeah, yeah, no one likes standardized tests, but right now we have no data at all. This would be a start.
Lisa Starrfield
Wed, Jan 27, 2010 : 10:45 a.m.
Lehigh, I have to say when I followed your link I was momentarily confused by the data. 3545% of students at the elementary level are white according to that table. I think perhaps it needs editing. :)
DagnyJ
Wed, Jan 27, 2010 : 10:42 a.m.
Lehigh, perhaps I should say disadvantaged students. In general, researchers would identify those students in Ann Arbor as poor, African-American, Latino. Asians and middle eastern students in this city are, in general, not considered disadvantaged. What would be most useful is if we had some construct of socioeconomic status in the district that more closely resembles what is associated with students' with the greatest educational need. That construct would include a measure of poverty and minority status. I suspect that the ELEMENTARY schools with the greatest number of poor and minority (black and Latino) students spend less than other schools.
Lisa Starrfield
Wed, Jan 27, 2010 : 10:40 a.m.
Dagny, I would have no way of accessing that information. You would have to ask HR.
Grumpy
Wed, Jan 27, 2010 : 10:37 a.m.
@DonBee. Thanks for all your efforts. I too would really like to see the database. Not sure how you would be able to make that happen though. To make life easier on DonBee and others crunching numbers and raising good questions, why can't the school district follow the city's lead, as was reported Jan. 20 in the AA Chronicle, by giving us access to the raw data files used in their "user friendly" budget in the form of comma-separated value (CSV) files?
Steve Norton, MIPFS
Wed, Jan 27, 2010 : 10:37 a.m.
I have to agree that the headline is unnecessarily inflammatory. Just because some data is presented in a certain way by the district in the "user friendly budget" does not relieve anyone of the responsibility of getting the whole picture before drawing conclusions. Federal Title I and IDEA funds are a critical part of the picture. It is odd that Mitchell is so far down the per-pupil spending list based on local-source funds. On the other hand, Mitchell receives significantly more federal Title I money than Pittsfield, which is next in line in free and reduced lunch count. Seems like spending is relatively high at both Mitchell and Pittsfield, but with more federal money in the mix at Mitchell, for whatever reason. Some kind of unified accounting of instructional spending from all sources would be much more helpful. Lastly, everyone should know that the per pupil spending numbers are very sensitive to the number of teachers at a building. With about 15-18 classroom teachers at an elementary school, plus or minus one position makes a huge difference to the numbers. At my kids' school, we are in limbo until Labor Day each year about how many teachers we will have, or how many split classes we will have. A small shift in student count right before school starts can determine whether we get an extra teacher or not (and thus how many split classrooms we have).
Lehigh
Wed, Jan 27, 2010 : 10:33 a.m.
DagnyJ, the information you're looking for is here: http://www.aaps.k12.mi.us/aaps.about/aaps.data/headcount_by_ethnic_group_by_school. There are numerous ethnic groups listed. Trying to decide who is a minority and who is not is a thorny issue. If we take the definition that minority = not Caucasian, then the correlation between % non-white students at an elementary school and average per student spending is about 0.4 -- meaning higher proportions of non-white students are associated with more per student spending. If you wanted to look only at % African-American, the correlation is much lower (0.1), which is not significant, but it is not negative. Meaning, there's a slight tendency for schools with a higher percentage of African-American students to get more per student spending. Finally, if you wanted to look at the % of Caucasian students, there is a negative correlation (-0.4). Meaning that a higher proportion of white students at a school is associated with lower per-student spending. All of this is associative, and correlation does not imply causation. But there is no evidence to suggest that higher proportions of minority students at a school is associated with lower per-student spending.
Technojunkie
Wed, Jan 27, 2010 : 10:32 a.m.
Maybe teachers at the "poorest" schools burn out and leave the profession before they can become expensive, experienced teachers? Teachers are paid by seniority and credentials, not merit. Just saying, statistics will only get you so far here.
Lisa Starrfield
Wed, Jan 27, 2010 : 10:31 a.m.
Don, I may be mistaken but given the McMansions in the area and several new schools, it seems that Plymouth-Canton has been growing recently. So I wonder what the average experience of their teachers are in comparison with Ann Arbor's teachers? Our teaching staff is very experienced. I'm also wondering how their class sizes, electives and support staff compare with Ann Arbor as well. I really don't think you can compare per pupil spending on staff without having at least that information as well... you might be comparing apples to oranges.
DagnyJ
Wed, Jan 27, 2010 : 10:26 a.m.
Lisa, how many teachers applied for openings at Mitchell in the last two years?
Lisa Starrfield
Wed, Jan 27, 2010 : 10:20 a.m.
Don, Please keep in mind that teachers newest to the district are the ones most likely to be moved by changes in enrollment and restructuring. For example, as a result of the middle school restructuring (and a rather odd set of circumstances) I was originally moved from Clague to Northside, then back to Clague for a semester, then to Slauson. Moves all imposed by the district because of restructuring a few years back. I was given the chance to return to Clague this year and I did. Some of the teachers who were moved to other buildings due to restructuring have chosen to stay. Teachers have the option of applying for open spots in the district to switch schools if they like. Some move because they want to teach a different grade level. Some move because they want to be closer to their home or their child's school. Some move because they want to return to a building and a staff that that they think of home.
Lehigh
Wed, Jan 27, 2010 : 10:05 a.m.
DonBee, I would love to see the database. Does it have administrative spending as well?
DagnyJ
Wed, Jan 27, 2010 : 9:59 a.m.
David Jesse, can also post the minority percentage at the elementary schools, along with free lunch? I would hypothesize that elementary schools with high numbers of minority students spend less. Then schools with lower minority but higher poverty would be spending more than schools than schools with higher proportions of poor and minority students.
DonBee
Wed, Jan 27, 2010 : 9:53 a.m.
Dr. I. Emsayin - The numbers I posted are from the AAPS building by building break down. They are the AVERAGE total cost of the teacher (salary, benefits, special pay, etc) to the district. I only posted elementary numbers. If there are better numbers - then I would suggest that the AAEA go to the district and get them to publish better numbers (remember this is what the district provided to the voters) or that the AAEA publish better numbers themselves. Having stumbled on the state-wide reporting system for revenue and expenses. I now have access to all the districts in the state. On a per student basis - AAPS spends in Salary only now - $1100 more per student for teacher salaries than the state average and $800 more than Plymouth-Canton. This is not the only place that AAPS outspends the state average or Plymouth-Canton. To be fair the Custodial Staff and Bus Drivers, it looks like the AAPS numbers are in line with both the State average and the Plymouth-Canton numbers. I am doing my own analysis of the numbers right now. If others would like to see my analysis or get the link to the database (and it is a database) I will be happy to post it.
Jim Mulchay
Wed, Jan 27, 2010 : 9:50 a.m.
Is there a report that maps performance (I'd assume MEAP) by school along with student/teacher ratio and AAPS funding? How does AAPS (not the state or US) judge the performance of the schools? It is my impression that MEAP may not be the best way to judge if schools are educating students successfully.
belboz
Wed, Jan 27, 2010 : 9:45 a.m.
With the title of that article, and the picture of a minority as reference material - someone is certainly trying to drum up an issue where one doesn't exist. Is Al Sharpton coming to town???? When Pittsfield is at the top in terms of spending per pupil, and Mitchell is at the bottom - and when Scarllet is also at the top - then it is less about a lack of social concern, and more about a lack of consistency. Perhaps it is because teachers are younger at Mitchell and so the salary is less. Perhaps they are better off for it with the younger teachers because they can relate better with the kids. Who knows. I don't think it is as socially / racially motivated as the article makes it. Boy, this "user friendly" Ann Arbor Schools budget has created a very unfriendly Ann Arbor.
Lehigh
Wed, Jan 27, 2010 : 9:44 a.m.
I agree completely with Andrew Thomas about the inflammatory headline. If we use free lunch % as the estimate of school poverty, the correlation between free lunch % and per student school spending is... 0.4. A *positive* correlation, meaning higher school poverty is associated with more school spending. If we take out Pittsfield, which seems to be an anomaly spending-wise, the correlation drops to 0.2 -- weak, but still positive. DonBee, thanks for the analysis. I did a quick regression of % free lunch on average teacher salary (correlation -.328, meaning higher free lunch %'s are associated with lower teacher salaries). On average, a gain of 1% on free lunch % leads to an $84 decrease in average teacher salary. In other words, an increase of 10 percentage points in free lunch % leads to an $840 decrease in average teacher salary. BUT, the relationship is weak (not statistically significant, for those who care, if we should even be sig testing such a small sample). And the size of the effect itself is not huge. Using the predictive model, a school like Mitchell (61.2% free lunch) would have average teacher salaries about $4,500 less than a school like Wines (5.2% free lunch). And yes, I know the actual gap between Mitchell and Wines on average salary is over $10,000 -- I'm just saying what the model predicts based on all the other schools. This is quick and dirty linear regression; others may want to do fancier modeling.
Dr. I. Emsayin
Wed, Jan 27, 2010 : 9:31 a.m.
Teacher salaries, as shown in this article, reflect not only all benefits, but probably other pay indexes including summer school teaching, band and choir camp, department chair indexes, coaching indexes. Only the high schools have a department chair index; many coaches are at the middle or high school level rather than elementary level. Teachers at all levels are required to continue their education at their own cost, but make about two thousand dollars more for advanced degrees. Some teachers are required to have Master's degrees to teach their subject such as guidance counselors (none in elementary schools), librarians, school social workers and psychologists. From what the current salary scale shows, a first year teacher earns $38,098 this year and a teacher with 10 years (top of step scale)and a Master's earns $75,476. That is nowhere near what the article suggests. The district pays a set amount for benefits and most teachers pay up to $3k or more out of pocket for a better insurance plan.
Sarcastic1
Wed, Jan 27, 2010 : 9:21 a.m.
You pay less in, you get less out.
DagnyJ
Wed, Jan 27, 2010 : 9:07 a.m.
DonBee, excellent analysis. Thanks for this.
DonBee
Wed, Jan 27, 2010 : 8:51 a.m.
Andrew Thomas - The average total cost for a teacher at Wines and King are 4th and 5th highest of 21 grade schools. Look at the table I posted - sorted by teacher cost in my comment. I think the comment made by Dagny J is pretty close to accurate. The schools you mention as higher income all are above the average, the ones you mention as below the average are all very close to the average or below.
Andrew Thomas
Wed, Jan 27, 2010 : 8:36 a.m.
DagnyJ: So if your theory -- that experienced teachers leave low-income schools as soon as they can -- is true for Mitchell, why isn't it true for Pittsfield, Scarlett, Bryant and Northside? And why are more affluent schools such as Wines, King, Eberwhite and Thurston near the bottom? It just doesn't make sense.
David Jesse
Wed, Jan 27, 2010 : 8:36 a.m.
AA Open @ Mack was somehow left off the top chart. The school gets $7,414 per student and 9.7% of its students receive free/reduced lunch.
DonBee
Wed, Jan 27, 2010 : 8:29 a.m.
As to the comment on teacher costs per building - Based on the "User Friendly Budget" here are the costs per teacher per building - they include the cost of benefits and retirement. They are sorted high to low. Lakewood105,905.59 Pattengill104,554.01 haisley104,340.94 Wines102,643.21 King 102,193.48 Allen 102,063.77 Carpenter101,390.05 Lawton101,381.55 AA Open 100,748.36 Bryant100,018.70 Pittsfield 99,088.42 Dicken 98,153.08 Burns Park 97,666.55 Eberwhite 97,417.82 Thurston 97,333.31 Angell 97,304.68 Bach 96,817.37 Logan 96,570.82 Average 95,211.56 Northside 93,751.88 Abbott 93,392.65 Mitchell 92,348.83 Pre-school 60,998.40 There is NOT enough information in the "User Friendly Budget" to do a better job than this cut. But it brings up a couple of questions - if more experienced teachers bring the best results (comment made by Lisa S. a month ago) then why do we seem to have more young teachers in the schools with the largest number of low income students (this comment is based on the average teacher cost per building - the assumption is if it is lower - the teachers are on average younger)? Also I have to wonder about the cost of utilities and maintenance (not including Custodian costs - which are a separate number in the "user friendly budget") - at AA Open and in the Pre-School they seem out of line - based on the total number of rooms in the building (my numbers include all the rooms listed - not just classrooms). The numbers for the Elementary Schools are below. Abbott3,534 Allen 3,699 Angell7,575 AA Open 10,271 Bach 4,732 Bryant4,513 Burns Park4,351 Carpenter4,195 Dicken4,721 Eberwhite4,488 haisley3,683 King 4,787 Lakewood4,987 Lawton4,401 Logan5,874 Mitchell6,840 Northside4,868 Pattengill4,808 Pittsfield4,736 Preschool 13,750 Thurston5,036 Wines2,084 Average 5,289 Here is a place that no one seems to have spent any time (at least that I can find) determining if the numbers make sense and that they are right. The number of rooms (again total number of rooms indicated by the budget - not just classrooms) that a Custodian is responsible for ranges from a low of 7 to a high of 10.2 in the elementary schools. I don't know if this is good or bad and if the range is acceptable to the district and the teachers who have to deal with the state of their classrooms or not. I would post on the average cost of building staff, but they lumped Custodians and Principals together in the "user friendly" budget and so all I can come up with is a number that is unfair to the Custodians and Secretaries - so I will just give you the elementary average cost (all salary and all benefits for all members of the school staff) - $95,211 for the 2009-2010 budget year. Again there is not enough information to break it down to Principals, Custodians, and Other Staff in the budget (the counts are there, but not the salary and benefits). I wish they would do so, and I have asked. As to Mitchell - another interesting number emerges - the one on the ratio of teachers to students. I am posting 2 sets of numbers side by side to provide a fair comparison - because Mitchell seems to have a large number of non-teacher members of the instructional staff (again based on the budget). These do not show up as Teachers, but they do seem to count as instructional staff. So to the numbers (Students per): SchoolTeacher OnlyInstructional Abbott 24.8 19.3 Allen 21.9 17.3 Angell 24.7 17.4 AA Open 24.5 20.1 Bach 25.6 18.8 Bryant 19.7 15.5 Burns Park 24.2 18.7 Carpenter 22.2 17.3 Dicken 23.7 19.2 Eberwhite 26.8 20.8 Haisley 23.8 18.7 King 25.2 19.8 Lakewood 23.7 19.1 Lawton 23.4 18.4 Logan 23.9 18.1 Mitchell 39.7 22.2 Northside 21.2 16.6 Pattengill 25.0 19.9 Pittsfield 19.7 15.3 Preschool 66.2 7.2 Thurston 27.0 20.3 Wines 24.6 19.8 Average 24.9 17.3 One of the missing pieces here is student teachers - which are found frequently in the classrooms in the elementary schools. I note that from personal observation - they tend to be assigned to experienced teachers - since the most experienced teachers (based on average teacher salaries) are in some of the higher income schools - the ratios including student teachers are probably even better in those schools. I only posted elementary schools in this post - it is long enough. If anyone cares for the middle or high school numbers - have those as well. Again they are all based on the numbers published by AAPS in the user friendly budget. Please do your own research and come to your own conclusions.
SallyDay
Wed, Jan 27, 2010 : 8:28 a.m.
Why isn't Ann Arbor Open @ Mack included in the charts for elementary and middle schools?
Dudley
Wed, Jan 27, 2010 : 8:27 a.m.
Looks like they need to get the cost of teachers down... We as a state can't afford such high salaries.
DagnyJ
Wed, Jan 27, 2010 : 8:03 a.m.
Andrew Thomas: The *anomaly* of having the least experienced teachers at the poorest school is not unique. This occurs across the nation. The poorest schools have the least experienced teachers. Why? Research shows that once teachers can move to a school where students are not disadvantaged, they do. It means that, in this district like districts elsewhere in the US, the kids who need the most help, the best instruction, etc. get teachers who are often the least able to provide it. The headline is correct. It's inflammatory because it's true.
Andrew Thomas
Wed, Jan 27, 2010 : 7:47 a.m.
The headline to this article, while technically accurate, is quite misleading and, in the context of the highly-charged debate regarding school funding, inflammatory. The headline could just as easily (and just as accurately) have read, "Ann Arbor School District Spends Most Amount of Money on its Poorest Middle School". The headline suggests that the District is systematically short-changing its poorest students. In fact, if you look at the list of student spending per elementary school, you will see that the highest spending per student occurs at Pittsfield, which has the second-poorest population (as measured by free/reduced lunch percentage). In fact, six of the top seven schools (in terms of spending per student) are among the District's poorest schools. I do not know why Mitchell is at the bottom of the heap, but the article (which, aside from the headline, is objective and factual) provides a number of clues. It may be nothing more than an anomoly relating to the experience (and hence pay) of its particular mix of teachers. Also, excluding special ed and Title I funding from the averages adds to the distorted picture. Up until now, David Jesse's series on school funding has been very informative and fair. I don't know if this headline was just a lapse in judgment, or if it represents a deliberate editorial decision to stir the pot. Anyone who takes the time to read the entire article should get a reasonably good picture of the situation, but someone who skims the headlines is bound to get an incorrect impression.